
Budgets slip, forecasts miss, and leaders lose time when numbers live in too many places. Spreadsheets, emails, and disconnected tools create delays and confusion. As a result, teams debate the data instead of acting on it. Financial performance software helps you turn raw financial and operational data into clear decisions. It connects planning, reporting, and analysis in one workflow. Therefore, you can spot risks earlier, explain results faster, and stay aligned across teams.
Choosing the right tool is only the start. Consequently, we will walk through implementation steps, change management, and governance so adoption sticks. Finally, you will learn how to measure ROI with practical metrics, including cycle time, forecast accuracy, and time saved on reporting.
What Financial Performance Software Is and Why It Matters
Financial performance software helps you track results, plan ahead, and explain what changed. It brings budgets, forecasts, actuals, and key metrics into one place. As a result, leaders spend less time debating numbers and more time acting on them.
In many companies, data lives in spreadsheets, email threads, and separate tools. However, that setup makes it easy to miss updates, copy the wrong figure, or use outdated assumptions. Therefore, teams lose confidence in reports and delay decisions.
What financial performance software includes
Most solutions combine planning, consolidation, reporting, and analysis. Financial performance management software focuses on budgeting, forecasting, and scenario planning, so you can test “what if” changes quickly. Additionally, it supports approvals and version control, which keeps everyone aligned.
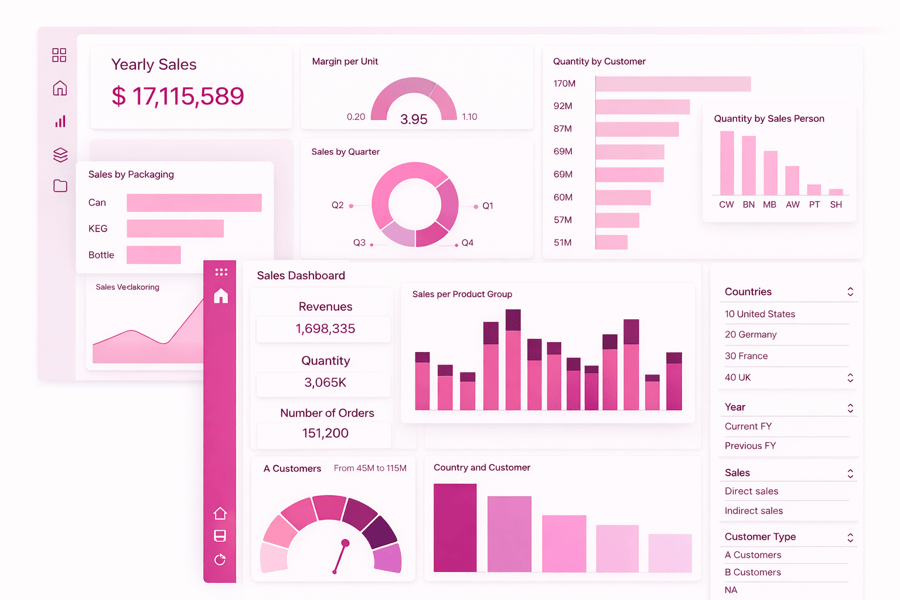
Financial performance reporting software turns data into dashboards, KPI views, and clear narratives for executives. Consequently, you can show not only what happened, but also why it happened and what to do next.
Why financial performance software matters for ROI
A modern financial performance platform connects to your ERP, CRM, and data warehouse to reduce manual work. It also standardizes definitions, so revenue, margin, and cash mean the same thing across teams. As a result, you close faster and spot risks earlier.
- Faster month-end and fewer spreadsheet fixes
- More accurate forecasts with consistent drivers
- Clear ownership through workflows and audit trails
- Better decisions because teams trust the numbers
This article explains how to choose the right tool, implement it without chaos, and measure ROI with practical metrics. It also covers core capabilities, reporting best practices, integrations, and vendor evaluation steps.
Core Capabilities of Financial Performance Software
Financial performance management software should do more than store numbers. It should help you plan, track, and improve results in one place. As a result, finance teams spend less time fixing data and more time guiding decisions.
Planning, budgeting, and forecasting
Strong tools support driver-based planning, rolling forecasts, and scenario modeling. Therefore, you can test “what if” changes like price shifts or headcount plans fast. Additionally, you can lock versions and track who changed what.
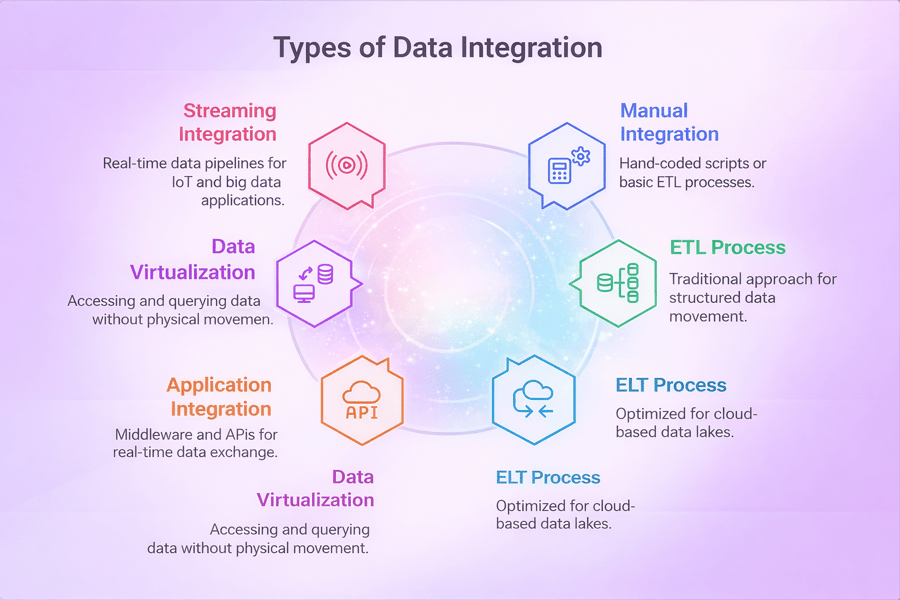
Data integration and a single source of truth
A reliable financial performance platform connects to ERP, CRM, payroll, and billing systems. However, integration alone is not enough; you also need data validation and clear mapping rules. Consequently, your team trusts the numbers and stops debating definitions.
Close, consolidation, and financial controls
Many teams use financial performance software to speed up the month-end close. It can automate intercompany eliminations, currency conversion, and consolidation logic. Additionally, approvals, audit trails, and role-based access reduce risk.
Reporting, analysis, and collaboration
Financial performance reporting software should deliver dashboards, variance analysis, and commentary in the same workflow. For example, users can drill from a KPI to the transaction detail and then add notes for stakeholders. As a result, leaders get context, not just charts.
- Standard templates for P&L, balance sheet, cash flow, and KPI packs
- Flexible dimensions like product, region, channel, and customer segment
- Alerts for exceptions, such as margin drops or spend overruns
- Workflow for review cycles, approvals, and sign-offs
When these capabilities work together, you reduce manual effort and improve decision speed across the business. The right setup also scales as your data, teams, and reporting needs grow. Over time, it becomes a practical foundation for business automation tools.
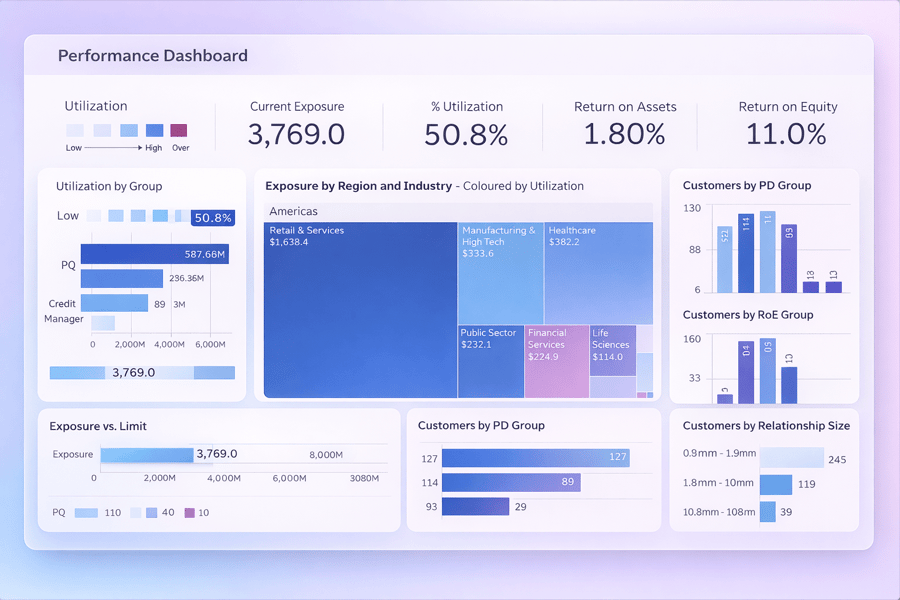
Financial Performance Software: Dashboards, KPIs, and Narratives
Financial performance reporting software turns raw numbers into clear, shared answers. It helps leaders see what changed, why it changed, and what to do next. As a result, teams spend less time debating data and more time acting on it.
Dashboards that stay focused
Dashboards work best when they show only what decisions need today. Start with a few role-based views for executives, finance, and department owners. Additionally, use filters for region, product, and time so people can drill down without creating new reports.
When you connect dashboards to financial performance software, updates happen on schedule and stay consistent. Many teams standardize these views inside a financial performance platform so everyone sees the same definitions. In practice, that alignment cuts rework and speeds up monthly reviews.
KPIs that drive action
Strong KPIs link to goals and owners, not just totals. Choose leading indicators (like pipeline coverage) and lagging indicators (like revenue and margin). Therefore, you can spot risk early and correct course before the quarter ends.
- Define each KPI with a clear formula, data source, and refresh cadence.
- Set targets and thresholds, then add alerts for exceptions.
- Compare actuals vs budget, forecast, and prior period in one view.
Narratives that explain the “why”
Numbers need context, so pair charts with short commentary. With financial performance management software, you can capture drivers like price, volume, mix, and one-time events. Consequently, stakeholders understand variance faster and approve decisions with less back-and-forth.
To keep reporting consistent, create a narrative template for each close cycle and tie comments to the same KPI set. This approach also makes audit trails easier because explanations live next to the metrics. If you want a broader view of connected planning and reporting, explore how Financial Performance Software supports dashboards, KPI governance, and narrative workflows, and compare those capabilities to the features of marketing automation software.
Choosing a Financial Performance Platform: Must-Have Integrations and Data Model
Choosing the right financial performance platform starts with your data. If the tool cannot connect to your systems, you will chase numbers instead of decisions. Therefore, list your source systems first and confirm the platform supports them without heavy custom work.
Must-have integrations to prioritize
Strong integrations reduce manual exports and cut close-cycle stress. Additionally, they improve trust because everyone works from the same source of truth. When you evaluate financial performance software, look for connectors that handle both data loads and ongoing sync.
- ERP and GL for actuals, journal detail, and chart of accounts
- CRM for pipeline, bookings, and renewal forecasts
- HRIS for headcount, compensation, and hiring plans
- Billing and payments for revenue schedules and cash visibility
- Data warehouse for governed, cross-team reporting
Data model: how to keep reporting consistent
A clean model makes your financial performance management software easier to scale. Start with shared dimensions like time, entity, department, product, and customer. Then, define clear rules for currency, intercompany, and allocations so reports reconcile every time.
For example, align account mappings and metric definitions across teams so dashboards match board reports. Your financial performance reporting software should also support drill-down to transactions and keep an audit trail for changes. In Financials, that traceability protects credibility during reviews and budget cycles.
Finally, test integrations and the model with real scenarios, not sample data. Run a monthly close, a reforecast, and a variance review to spot gaps early. Once the data flows cleanly, your platform can also connect performance insights to execution, including ppc automation software.
Use Cases by Team: Finance, Marketing, Sales, and Operations
Different teams ask different questions, yet they all need one source of truth. Financial performance software helps each group plan, track results, and act faster. Additionally, it reduces manual work, so people spend more time on decisions and less time on data cleanup.
Finance: close faster and plan with confidence
Finance teams use financial performance management software to build budgets, forecasts, and scenarios in one place. As a result, they can test what if changes for headcount, pricing, or costs without rebuilding spreadsheets. Many organizations use financial planning and financial reporting tools to improve visibility and strengthen decision-making.
- Automate consolidations and eliminate version control issues.
- Run rolling forecasts and compare plan vs. actual by entity, product, or region.
- Track cash flow drivers and flag variances early.
- Support financial planning and long-term forecasting.
- Improve financial reporting accuracy and speed.
Marketing: connect spend to revenue outcomes
Marketing leaders need to prove impact, not just activity. With a financial performance platform, they can align campaign spend with pipeline, revenue, and margin. Consequently, they can shift the budget toward channels that perform.
- Plan budgets by channel and campaign, then monitor pacing weekly.
- Measure CAC, LTV, and payback periods with consistent definitions.
- Share clear performance narratives using financial performance reporting software.
- Use performance measures to evaluate campaign effectiveness.
- Better track performance across channels and initiatives.
Sales: forecast accurately and improve coverage
Sales teams use financial performance software to link pipeline data to revenue targets. Therefore, they can spot gaps in coverage early and coach reps on the deals that matter most.
- Forecast by territory, segment, and product line with one set of rules.
- Track win rates, sales cycle length, and discount impact on margin.
- Align quota, capacity, and hiring plans to revenue goals.
- Monitor employee performance against sales targets.
- Use business performance management practices to improve forecasting accuracy.
Operations: manage costs, capacity, and service levels
Operations teams focus on efficiency and delivery. They use financial performance management software to tie operational metrics to cost and profitability. However, they also need fast, visual reporting to keep teams aligned.
- Monitor unit costs, utilization, and throughput against targets.
- Plan inventory, staffing, and production with scenario modeling and planning tools.
- Standardize KPI dashboards across sites with financial performance reporting software.
- Support risk management by identifying operational bottlenecks early.
- Use consistent performance measures across teams and locations.
Organizations that invest in enterprise performance management, performance management solutions, and financial performance management FPM gain a clearer view of company results. Combined with stronger financial reporting, better financial planning, and tools that track performance, these platforms improve business performance management and support long term growth.
When these teams share the same definitions and workflows, leaders can act on one plan and one set of numbers. As a result, reviews become shorter, decisions become clearer, and accountability improves across the business. To extend this view into digital revenue drivers, many companies also connect ecommerce analytics tools.
Benefits and ROI of Financial Performance Software for Faster Decisions
Financial performance software helps leaders move from debating numbers to acting on them. It creates one trusted view of revenue, cost, cash, and margin. As a result, teams spend less time reconciling files and more time improving outcomes.
Faster decisions with fewer surprises
When data updates automatically, you see issues early and respond quickly. For example, you can spot a margin drop by product line before it hits the quarter. Consequently, you can adjust pricing, staffing, or spend while there is still time to change the result.
Financial performance reporting software also improves clarity in meetings. Dashboards and KPI narratives show what changed, why it changed, and what to do next. Therefore, stakeholders align faster and avoid circular discussions.
Measurable ROI you can track
ROI improves when you cut cycle time and reduce errors. Financial performance management software can shorten budgeting and forecasting because it standardizes inputs and calculations. Additionally, it reduces rework by enforcing version control and audit trails.
- Lower labor cost from fewer manual exports, fixes, and re-forecasts
- Higher forecast accuracy from consistent drivers and scenario planning
- Better cash management through faster visibility into working capital
- Stronger accountability with clear owners for KPIs and actions
How to calculate payback
Start with a baseline: hours spent on reporting, forecast cycles, and close-related adjustments. Then estimate the new time after rollout and multiply by fully loaded labor cost. Finally, add impact metrics like reduced stockouts, improved collections, or avoided spend, which a financial performance platform makes easier to quantify.
To keep the ROI real, define three to five KPIs, review them monthly, and tie each to a decision you will make. This way, you link the tool to action, not just visibility, and you can extend the same discipline to procurement insights and analytics.
Comparing Financial Performance Management Software vs Spreadsheets and BI Tools
Teams often start with spreadsheets because they feel flexible and familiar. However, as data grows, spreadsheets become slow to update and hard to trust. In contrast, financial performance management software brings structure, controls, and repeatable processes.
Spreadsheets for financial performance software: fast for ad hoc work, risky for scale
Spreadsheets work well for quick models, one-off scenarios, and small datasets. Additionally, they let analysts test ideas without waiting on IT. Yet version control breaks down, formulas drift, and manual copy-paste invites errors.
- Pros: speed, flexibility, low cost to start
- Cons: weak audit trail, fragile logic, limited collaboration
BI tools: great visuals, limited planning and write-back
BI tools shine when you need charts, slicing, and fast exploration. Therefore, many teams use them as a front end for reporting. However, most BI stacks struggle with planning, approvals, and write-back workflows that finance needs.
If you rely only on BI, you may still run budgets and forecasts in spreadsheets. As a result, definitions can differ across reports, and reconciling numbers takes time. It reduces that gap by tying KPIs to governed calculations and narratives.
Financial performance software: a system for planning, close, and accountability
Financial performance software helps you standardize drivers, align departments, and track changes. Consequently, you spend less time reconciling and more time explaining results. It also supports permissions, audit logs, and workflow steps that protect sensitive data.
- Central metrics and consistent definitions across teams
- Driver-based planning with scenarios and approvals
- Automated consolidations and controlled data inputs
- A scalable financial performance platform that connects to ERP, CRM, and data warehouses
Choose spreadsheets for small, temporary work, and choose BI for exploration and visualization. However, when you need governed planning, repeatable reporting, and a clear audit trail, financial performance management software usually delivers the best long-term value, especially when it also supports procurement data management.
Implementation Roadmap for a Financial Performance Software: Timeline, Change Management, and Governance
A strong rollout plan turns financial performance software into a daily habit, not a stalled project. Start by setting a clear goal, such as faster close, better forecasts, or cleaner KPI reporting. Then align the plan to your calendar so finance and business teams can support the work without burning out.
Timeline: a practical phased rollout
Most teams move faster with a phased launch. First, implement one high-value workflow, prove it works, and then expand. As a result, you reduce risk and build confidence early.
- Weeks 1-2: Define scope, success metrics, and data owners.
- Weeks 3-6: Connect sources, map key dimensions, and validate data.
- Weeks 7-10: Build core models in financial performance management software and test planning and consolidation.
- Weeks 11-12: Launch dashboards in financial performance reporting software, train users, and go live.
Change management: drive adoption from day one
Change management works best when you focus on roles, not features. Therefore, create simple “day in the life” guides for finance, managers, and executives. Additionally, run short weekly office hours so users can ask questions with real data.
Pick a few champions in each department and give them early access. They will spot gaps, share quick wins, and reduce resistance. Consequently, your financial performance platform becomes the default place to review performance.
Governance: keep data trusted and decisions consistent
Governance protects speed and accuracy at the same time. Define who can change metrics, who approves new dimensions, and how you document logic. However, keep rules lightweight so teams can still move fast.
Use a monthly review to retire unused reports, confirm KPI definitions, and check access rights. This keeps financial performance software clean as the business grows and supports connected planning across functions, including multi channel inventory management.
Vendor demos can look the same, so you need a clear scorecard. Start by listing the decisions you want to speed up and the KPIs you must trust. Then map those needs to your reporting, planning, and close process in financial performance software.
Ask the right questions in discovery
First, confirm fit for your use cases, not just features. Additionally, ask vendors to show the exact workflow your team will use, with your chart of accounts and real KPI definitions. That approach exposes gaps early in financial performance reporting software.
- How do you model revenue, costs, and allocations, and how long does setup take?
- What data connectors do you support, and do you handle incremental refresh?
- Can we write narratives, add commentary, and track approvals in one place?
- How do you manage security by role, entity, and dimension?
- What is your approach to audit trails, version history, and change logs?
- How do you support budgeting, forecasting, and scenario planning in financial performance management software?
Score vendors with a simple, repeatable model
Use weighted scoring so the best-looking demo does not win by default. However, keep the categories limited so stakeholders can score fast and consistently. As a result, you can defend the final choice with facts.
- Data and integrations (25%): ERP, CRM, payroll, and data warehouse connections.
- Reporting and analytics (25%): dashboards, drill-down, narratives, and exports.
- Planning and close support (20%): forecasts, workflows, and consolidation needs.
- Governance and security (15%): roles, approvals, auditability, and compliance.
- Usability and adoption (10%): learning curve, templates, and self-serve reporting.
- Total cost and vendor health (5%): pricing clarity, roadmap, and support SLAs.
Finally, run a short proof of value in your target financial performance platform with two real reports and one forecast cycle. Consequently, you will see data quality, speed, and stakeholder adoption before you sign. Close by confirming references in your industry and validating integration plans with IT and finance leaders, including order management software.
Financial Performance Software: Conclusion
Choosing the right financial performance software starts with clarity. You need a clear view of your goals, your data, and the decisions you want to speed up. When you align those pieces, you reduce rework and improve confidence in every number.
Throughout this guide, we covered what matters most: core planning and forecasting features, clean reporting, and strong integrations. Additionally, we looked at use cases across finance, marketing, sales, and operations. As a result, you can build a shared view of performance instead of debating spreadsheets.
What to remember before you commit
- Pick financial performance management software that matches your planning cycle and approval flow.
- Prioritize financial performance reporting software that makes KPIs easy to find, explain, and trust.
- Choose a financial performance platform with a solid data model and the integrations you will actually use.
- Plan implementation with owners, timelines, and governance; otherwise, adoption will stall.
However, software alone does not create ROI. You get value when teams use the same definitions, refresh data on a schedule, and act on insights quickly. Therefore, measure success with a few clear metrics, such as forecast accuracy, close time, and the time it takes to answer leadership questions.
Next, turn this into action. Shortlist two to three tools, run a focused pilot, and score vendors against your must-haves. Consequently, you will choose financial performance software that delivers faster decisions and measurable results.
Frequently Asked Questions
What financial metrics are used to measure performance of a software company?
Common metrics include ARR and MRR growth, gross margin, net revenue retention, CAC, LTV, churn, and operating cash flow. Many teams also track Rule of 40, burn multiple, and customer payback period. These indicators connect revenue quality, efficiency, and cash health, helping leaders spot trends and prioritize actions.
What is financial performance software and what does it do?
Financial performance software helps organizations plan, measure, and improve results by consolidating financial data, automating reporting, and tracking KPIs against budgets and forecasts. It typically supports dashboards, variance analysis, scenario modeling, and workflow approvals. The goal is faster insights, fewer manual spreadsheets, and clearer alignment between finance and business teams.
How is financial performance management software different from accounting software?
Accounting software focuses on recording transactions, managing the general ledger, and producing statutory financial statements. Financial performance management software builds on that data to support budgeting, forecasting, driver-based planning, and performance analysis. It enables multi-department planning and “what-if” scenarios, giving leadership forward-looking insights rather than only historical reporting.
What features should I look for in a financial performance platform?
Look for strong integrations (ERP, CRM, HRIS), flexible modeling, role-based access, audit trails, and automated consolidation. A good financial performance platform should offer dashboards, variance commentary, scenario planning, and workflow controls for approvals. Also prioritize data governance, security, and the ability to scale across entities, currencies, and business units.
How does financial performance reporting software improve reporting accuracy and speed?
Financial performance reporting software reduces manual work by pulling data from source systems, applying consistent definitions, and automating recurring reports. Standard templates and controlled calculations lower the risk of errors from copy-paste spreadsheets. Teams can refresh reports quickly, drill into variances, and distribute consistent dashboards to stakeholders with less back-and-forth.
How do I choose the right financial performance software for my business?
Start with your use cases: budgeting, forecasting, consolidation, KPI dashboards, or board reporting. Evaluate data connectivity, ease of use for non-finance users, and support for your planning model. Compare total cost, implementation effort, and vendor support. The best financial performance software fits your processes while improving speed, control, and decision-making.

